Unsplash / Joshua Mayo
If you’re asking, “what is a metric in Google analytics?” you’ve come to the right place for answers.
You only need to see my blog for other works I’ve written to know I’m an expert in many fields, and analytics is a passion of mine. Want to know about numbers in a dimension? I’m your guy.
So, let’s not waste time and explore the Google Analytics metric world.
Contents
What Are Metrics In Google Analytics?

Pexels / Lukas
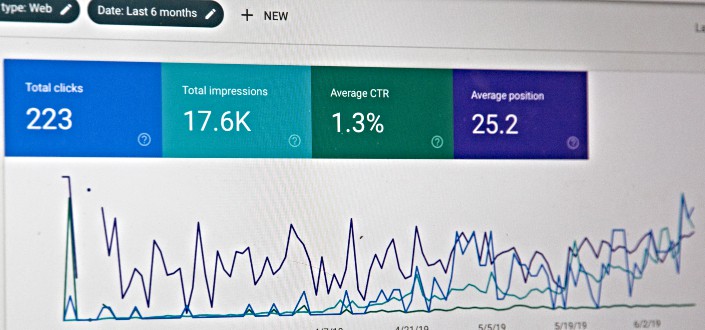
In Google analytics, metrics are quantitative measurements. They’ve expressed number sets such as number values, percentages, dollars, or time. A Google Analytics standard metric or custom metrics you create are used in web analytics tools for data that demonstrate how a website or something is performing to a given dimension.
What Is Default Dimension In Google Analytics?

Unsplash / Lukas Blazek
A dimension is an attribute of>website traffic and users of your site. User browser, exit page, which site content they looked at, session durations, country, and language are some default dimensions in Google Analytics.
You can narrow your results for a more custom report by including a custom dimension or using a secondary dimension to get more detailed information like age or city they live in. An example is using a default dimension like ‘visitor’s device’. You then add a secondary dimension by adding which city this device is more often used by a user.
The Google Analytics dashboard will have recommended dimension options in a drop-down list, or you can use the search function to look for something else.
You can then use the Google Analytics dimension to better understand and act on the>analytics intelligence. What you learn can help you improve your user engagement and increase your page view. It can also help with informed and focused content marketing and targeted Google ads through social media or embedded in your site content.
Useful Metrics In Google Analytics

Unsplash / Stephen Phillips – Hostreviews.co.uk
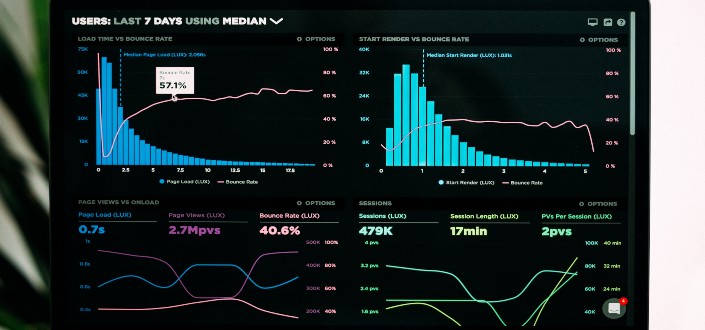
Dimensions and metrics are what make up the reports in Analytics. A metric, such as bounce rate, active user information, or total pageviews, is provided as a summary statistic for your site. You can evaluate the impact of your marketing activities on distinct user segments using this data.
Here are 7 useful metrics:
#1. Number of Users

Unsplash / Campaign Creators
User metrics show the total number of unique visitors to your site. This standard metric is helpful to know your traffic numbers.
#2. Number of Sessions

Unsplash / Georgia de Lotz
Sessions are any pageview, click, transaction, or other activity on your site. If a returning user comes back, a new session is recorded.
#3. New Users

Unsplash / Azat Satlykov
Google Analytics uses identifiers to determine if an individual visitor to your site is a “new user”. This can sometimes be inaccurate, however. For example, if that individual uses incognito mode, deletes their browser cookies, or uses a different browser or device for subsequent visits, they are not recognized as a “returning user”. They are labeled a “new user”.
#4. Average Time on Page

Unsplash / Markus Spiske
This metric calculates the time a user spends on a page on your website in a single session. This can give you an idea about your page’s user engagement. This metric offers valuable data as insight into what your user is hooked by for digital marketing purposes.
#5. Average Pages per Session

Unsplash / Carlos Muza
The average number of pages a user views in a single session on your site is known as average pages per session. Another metric that’s a strong indicator of user engagement is the number of pages a person interacts with on your site. However, it’s important to consider this data and average time on page because the layout of user funnels and the amount of content such as big text blocks might impact these numbers.
#6. Bounce Rate

Unsplash / Luke Chesser
This quantitative measurement is the percentage of users who visit only one page on a website before exiting. It’s known as the bounce rate. A high bounce rate could suggest technical issues, insufficiently addressed user needs, or a page lacking internal links. If your bounce rate is high, segment your site visitors to see if you can pinpoint the source of the problem.
#7. Conversion Rate

Unsplash / Stephen Dawson
The average number of conversions per interaction is a conversion rate. This is shown as a percentage. You should understand the conversion rate formula, as your goal conversion rate is one of the most crucial metrics to monitor no matter what kind of business you’re in. Even if you’re not eCommerce, you can always specify one or more actions that you wish your visitors to take when they visit your website. For example, become a subscriber to a content website. Your conversion rate is the percentage of site visitors that complete the desired action.
How To Change The Primary Dimension In Google Analytics Report

Pexels / Negative Space
In most Google Analytics reports, the primary dimension can be selected at the top of the>Google Data Studio is chosen by default, but you can change it by selecting the dimension you wish to see from the drop-down box.
Here is the step by step guide:
1. Above the data table in an Analytics report, you’ll find a horizontal list of primary dimension options.

Pexels / Yan Krukov
When you log in to your Google Analytics account, site search and select the website you want to find your dimension report in. You click the Customization tab on the left panel, where you can now click the + New Custom Report button.
Above the data table in an Analytics report is the primary dimension. It would show an item like Brower.
2. Click the primary dimension you want to apply to the table.

Pexels / PhotoMIX Company
An example would be, in the Behavior > Site Content > All Pages report, the default primary dimension is ‘Page’, with options to select ‘Page Title’, or choose from the ‘Other’ drop-down menu.
You can add multiple dimensions to your Google Analytics report by selecting the landing pages report. Click on the landing page you want to look into and change your primary dimension to the operating system, which will become the secondary dimension. Select the secondary dimension source/medium, which should now become a tertiary dimension.
Frequently Asked Questions

Unsplash / Myriam Jessier
If you’re just starting, Google Analytics can be daunting. Everything from the Google search console, understanding Google Analytics metrics and their purposes, to creating your own custom metric. The Google Analytics academy can help, but so might these answered frequently asked questions. Check them out:
How many metrics should you track?
You should track some crucial metrics to measure your content’s success, but track as many as you need to answer the question: what impact do you have on your visitors, and how effective are you with your call to action?
What’s the most important metric to track?
An important calculated metric is your traffic. It’s the foundation for all that follows: engagement and conversion. However, traffic isn’t always a reliable sign of how well your content is performing. The essential metric to keep an eye on is the rise in traffic over time. Of course, there is no set number of visitors that you should have. Each website has its own goals, and a varied traffic level before users begin to convert. However, all websites have the same goal in mind, and that’s to boost traffic.
What data does Google Analytics collect?
Google Analytics, like many other web analytics systems, collects basic page views and visit data such as device and operating system, browser type, and it also gathers information for the referring site your visitor came through. If you’ve set up individual user monitoring, you can also track a restricted number of user-level properties.
Does Google Analytics show IP addresses?
IP addresses are not visible in any of your Google Analytics reports. While Google collects IP addresses, it does not share this information with end-users.
What are the key features of Google Analytics?
Like any good universal analytics report, Google Analytics features campaign measurements like your traffic, it tracks your goals (conversions & user activity), can provide a detailed audience report, and data is customizable.
More Interesting Articles To Explore
To get a better and more in-depth understanding and appreciation for this powerful tool, read more about related topics here:
- Understanding the conversion rate formula is important for calculating it.
- Do you know the difference between Google Tag Manager vs. Google Analytics? Well, now’s the time to learn.
- What does USP stand for? Knowing is essential as it’s the heart of what makes you better than your competitors.
- You don’t need to be a Google Analytics genius to know that catering to your visitors’ wants and needs is what will keep them coming back. Having an understanding of website personalization can help with this.
In Conclusion
Now, do you know what is a metric in Google Analytics? It might have been a bit to take in, but understanding metrics, what a dimension is, and even getting an idea of how to use a custom metric is important to analytics. If you want to increase traffic to your site and improve your conversion rate, Google Analytics is a valuable tool for you.


